How to Measure Marketing ROI The Right Way
At its core, calculating your marketing ROI is pretty straightforward. The classic formula is (Net Profit / Marketing Cost) x 100. This gives you a clear percentage showing how much revenue you generated for every dollar spent.
But while the formula itself is simple, the real work—and where most businesses get tripped up—is in accurately defining your costs and, more importantly, attributing profit back to the right marketing efforts. A staggering 40% of marketers still cite proving ROI as their top challenge.
Why Measuring Marketing ROI Is So Critical

Let's be real: proving your marketing's value can feel like an uphill battle. With tight budgets and sky-high expectations, fuzzy metrics just don't fly anymore. A rock-solid understanding of your Return on Investment (ROI) is the single best tool you have for justifying budgets, earning trust from leadership, and simply making better decisions.
When you can confidently report on ROI, you fundamentally change how the business sees your department. You're no longer just a "cost center"—a team that spends money. Instead, you become a proven driver of revenue. That shift in perception is everything when it comes to getting the resources you need to scale what's working and try new things.
From Budget Defense to Strategic Offense
Calculating ROI isn't just about playing defense to protect your budget. It's an offensive strategy that ties every single campaign directly to business growth. Once you know which activities are actually making the company money, you can double down on them with confidence and cut the dead weight.
This data-backed clarity allows you to:
- Put money where it matters: Funnel your budget into the channels and campaigns that actually deliver, maximizing your overall impact. For example, if you discover your email marketing yields a 40:1 ROI while your display ads only return 2:1, you know exactly where to allocate the next dollar.
- Sharpen campaign performance: Spot underperforming areas and make precise tweaks to boost efficiency and returns. Maybe an A/B test reveals a new ad creative boosts conversion rates by 15%—that's a direct ROI improvement.
- Predict future growth: Use past ROI data to build reliable models that forecast how future marketing investments will translate into revenue.
The pressure to prove value isn't going away. In fact, it's intensifying. A recent HubSpot report found that 37% of marketers struggle to secure enough budget for their initiatives, a problem directly solved by demonstrating strong ROI. Furthermore, research indicates that companies that consistently measure ROI are 1.6 times more likely to receive higher budget allocations. It’s no longer optional.
Before we dive deeper, it's essential to get your inputs right. A great calculation starts with great data.
Key Components of Your Marketing ROI Calculation
A quick-reference table breaking down the essential inputs for an accurate marketing ROI calculation, helping you gather the right data from the start.
| Component | Description | Example |
|---|---|---|
| Marketing Cost | All expenses directly tied to a campaign. This includes ad spend, software, agency fees, and labor. | $5,000 in Facebook ad spend + $1,500 for a freelance designer + $500 for a landing page tool = $7,000 Total Cost |
| Gross Revenue | The total sales revenue generated directly from the marketing campaign before subtracting costs. | 100 sales at $250 each = $25,000 Gross Revenue |
| Net Profit | The revenue that remains after subtracting both the marketing cost and the cost of goods sold (COGS). | $25,000 (Gross Revenue) – $10,000 (COGS) – $7,000 (Marketing Cost) = $8,000 Net Profit |
Getting these three components dialed in is the foundation for everything that follows. Without accurate inputs, your ROI figure won't mean much.
Building a Bulletproof Business Case
At the end of the day, ROI is the language leadership understands. When you can walk into a meeting and say, "For every $1 we invested in this campaign, we generated $5 in profit," you build instant credibility. This is why knowing how to measure marketing effectiveness and maximize ROI is so fundamental to your success.
By consistently measuring and reporting on ROI, you not only validate your team's hard work but also create a powerful feedback loop for continuous improvement, ensuring every marketing dollar works as hard as possible for the business.
Define Your Goals Before You Touch a Calculator
It’s tempting to jump right into the ROI formula, but that's a classic mistake that leads to confusing, useless data. Think of it like trying to navigate a new city without a map—sure, you’re moving, but you have no idea if you're actually getting closer to your destination. Before you ever crunch a single number, you have to define what "return" even means for your business.
A vague goal like "increase sales" is practically meaningless. What kind of sales? From which customers? And over what time frame? The real trick is to set sharp, measurable objectives that tie your marketing activities directly to a real business outcome.
Aligning Goals with Business Reality
First things first, you need to get granular. What does a "win" actually look like for your specific business model? The answer is completely different depending on who you are and what you're selling.
Let’s look at a few real-world examples:
- SaaS Company: Your primary goal isn't just "more users." It might be to increase free trial sign-ups by 25% from small business owners over the next quarter. Your ROI calculation would then focus on the cost per trial and, eventually, the rate at which those trials convert to paid plans. For instance, if you spend $10,000 to get 200 trials and 20 of them convert to a $100/month plan, your first-month return is $2,000 against a $10,000 spend—a negative initial ROI that becomes positive over the customer's lifetime.
- E-commerce Store: You might aim to boost repeat purchases from existing customers by 15% during the holiday season. Here, success isn't just total revenue; it’s about fostering loyalty and increasing customer lifetime value. A campaign costing $5,000 that generates $30,000 in sales from return customers shows a direct 500% ROI on that specific segment.
- B2B Service Provider: The goal could be to generate 50 marketing qualified leads (MQLs) for the sales team this month. In this case, ROI is all about the quality of those leads and how effectively they move through your sales pipeline. If those 50 MQLs cost $15,000 to acquire and lead to $100,000 in closed deals, your ROI is substantial.
Each of these goals requires a totally different set of metrics and a unique way of looking at ROI. Without this kind of clarity from the get-go, you'll end up tracking numbers that don't actually impact your bottom line.
Brand Awareness vs. Direct Response: A Tale of Two Goals
One of the most common pitfalls I see is applying the same ROI expectations to completely different types of campaigns. You wouldn't judge a billboard's performance the same way you'd judge a "Buy Now" social media ad, and your ROI measurement needs to reflect that reality.
A direct response campaign, like a Google Ads promotion for a specific product, has a very straightforward job: get someone to click and buy. The ROI is pretty easy to calculate because the line between ad spend and sales is direct and happens quickly.
Brand awareness campaigns, on the other hand, are playing the long game. Their goal isn't an immediate sale but to build recognition, trust, and preference over time. Measuring their success requires looking at different signals.
Instead of immediate revenue, you'll want to track metrics that show your visibility and reputation are growing. Keep an eye on things like:
- Branded Search Volume: Are more people typing your company's name directly into Google? Tools like Google Trends can show a clear lift during and after a brand campaign.
- Direct Website Traffic: Are more users navigating straight to your URL? An increase here suggests better brand recall.
- Social Media Engagement: Are your mentions, shares, and follower counts on the rise? A 30% increase in brand mentions on X (formerly Twitter) post-campaign is a tangible result.
These metrics don't fit neatly into a simple ROI formula, but they are critical indicators of a healthy brand-building effort. They prove your message is connecting with your audience, which is a necessary first step for all future sales. And to make sure you're connecting with the right people, it's essential to first learn how to identify target customers.
By setting the right goals from the start, you ensure the ROI data you collect is not just accurate—it's meaningful. It turns the whole process from a simple math problem into a powerful strategic tool that tells you exactly where your marketing is winning.
Choosing the Right Metrics for Each Channel
Trying to measure every marketing channel with the same yardstick is a classic mistake. It's a surefire way to get misleading data and make bad decisions. The reality is, what "success" looks like for an email campaign is worlds apart from success in SEO, and your metrics have to reflect those differences. To get a true picture of your marketing ROI, you have to ditch the one-size-fits-all mindset.
It all starts with knowing the difference between vanity metrics and actionable metrics. Sure, seeing a spike in social media likes or impressions feels good, but those numbers rarely tell you anything meaningful about revenue. Actionable metrics, on the other hand—things like cost per qualified lead or customer acquisition cost—are directly tied to the financial health of your business.
Tailoring KPIs to Channel Strengths
The trick is to match your Key Performance Indicators (KPIs) to the specific job you've given each channel. A paid search campaign is built for speed and immediate conversions. Content marketing? That’s a long game, designed to build trust and authority over months, sometimes years. If you expect them to perform the same way, you'll end up cutting a high-value channel just because it hasn't delivered instant sales.
For a Google Ads campaign, the measurement is pretty direct. You're looking at things like:
- Return on Ad Spend (ROAS): The most straightforward metric. How much revenue did you generate for every dollar you put in? If you spend $1,000 and get $4,000 in sales, your ROAS is 4:1.
- Cost Per Conversion: This tells you exactly what you paid to get a customer to take a specific action, like filling out a form or making a purchase. A target CPA of under $50 for an e-commerce product is a concrete goal.
- Click-Through Rate (CTR): While not a direct ROI metric, a strong CTR is a great indicator that your ad copy and targeting are hitting the mark. A CTR of 2% might be average, while 5% could signal a winning ad.
These are bottom-of-the-funnel metrics. You spend X, you make Y. The line between them is short and clear.
A common pitfall is applying this direct-response logic to everything. When you do that, you completely devalue all the top-of-funnel work that’s essential for building a healthy pipeline but doesn’t result in an immediate sale.
Measuring the Impact of Long-Term Channels
Now, let's look at something like content marketing. A blog post or a whitepaper almost never leads to a sale on the first click. Its job is to attract people who are just starting their research, educate them, and nurture them over time. It's a critical piece of the puzzle, and as we cover in our guide on content marketing for startups, these efforts are what build a truly sustainable lead engine.
So, for content, your go-to KPIs are going to be different:
- Organic Traffic Growth: Are more people finding you through search? A 10% month-over-month growth is a solid benchmark.
- Lead Generation: How many people downloaded that e-book or signed up for your newsletter? This shows you're turning visitors into potential customers.
- Time on Page & Engagement: Are people actually reading what you wrote? An average time on page over 3 minutes suggests your content is resonating.
- Assisted Conversions: This is a big one. It shows you how often your content was a touchpoint for a customer who eventually converted, even if it wasn't the last touchpoint. In Google Analytics, you can see if a blog post was viewed weeks before a final purchase via a paid ad.
It's definitely tougher to connect these dots directly to a final sale, but the ROI is often massive and incredibly durable. A single blog post that ranks well on Google can bring in leads for years, delivering a much better long-term return than a paid ad that vanishes the second you turn off the spend.
A Comparative Look at Channel ROI
The financial returns from different channels can be wildly different, which just proves the point about needing tailored measurement. When you look at the data, email marketing is an absolute powerhouse, generating an average of $42 in revenue for every $1 spent. SEO is another strong performer, pulling in around $22.24 per dollar invested.
Meanwhile, paid search like Google Ads typically brings in about $2 in revenue for every $1 spent. And for many, social media ROI is still a bit of a mystery—a surprising 50% of marketers admit they can't measure it effectively. You can dig into more of these marketing ROI statistics on Firework.com.
This data is so important because it helps set realistic expectations. A 2:1 ROI from paid search is pretty standard. But if you got that same return from an email campaign? That would be a colossal failure.
To make this easier, I've put together a quick-reference table to help you align your channels with the right metrics.
Matching Marketing Channels to the Right Metrics
This table gives you a clear overview of how to connect different marketing channels to their main goals and the best KPIs for accurately tracking their return on investment.
| Marketing Channel | Primary Business Goal | Key Metrics to Track for ROI | Example KPI |
|---|---|---|---|
| Paid Search (PPC) | Immediate Lead Gen & Sales | ROAS, Cost Per Acquisition (CPA) | $5 CPA for a demo request |
| SEO & Content Marketing | Long-Term Authority & Traffic | Organic Traffic, Assisted Conversions | 20% increase in MQLs |
| Email Marketing | Nurturing & Repeat Business | Conversion Rate, Revenue Per Email | $1.50 revenue per email sent |
| Social Media (Organic) | Brand Awareness & Engagement | Reach, Engagement Rate, Referrals | 5% growth in referral traffic |
By taking this channel-specific approach, you'll start building a much more accurate and genuinely useful picture of your marketing performance.
You'll quickly learn how all the pieces work together, which lets you invest your budget more intelligently and prove the full value of every activity in your marketing mix.
A Practical Guide to Calculating Your ROI
Alright, you've set your goals and picked your metrics. Now it's time to roll up your sleeves and get into the numbers. The ROI calculation itself isn't complex, but its value is entirely dependent on the quality of your inputs. Let's start with the basic formula and then break down how to get the inputs right.
At its core, the formula for Return on Investment (ROI) is pretty simple:
ROI = (Net Return from Marketing – Marketing Investment Cost) / Marketing Investment Cost
Multiply that result by 100, and you've got your ROI percentage. It looks easy, but the real work—and where most people go wrong—is in accurately defining your "Return" and your "Investment Cost."
Defining Your Total Marketing Investment
One of the biggest mistakes I see is marketers only counting their direct ad spend. This gives you a skewed, overly optimistic ROI that doesn't reflect reality. To get a true number, you have to account for everything that went into the campaign.
Your total marketing investment isn't just one line item. It should include:
- Direct Campaign Costs: This is the obvious one—what you spent on Google ads, social media ads, or any other platform.
- Software and Tools: Think about the prorated cost of your marketing automation platform (e.g., a fraction of your $500/mo HubSpot subscription), analytics tools, and landing page builders.
- Content and Creative Production: Did you hire a freelance writer for $1,000? A graphic designer for $500? A video editor? Those expenses are part of your investment.
- Team and Labor Costs: Don't forget the people power. You need to factor in the salaries of your team members based on the actual hours they dedicated to this specific campaign. If a team member spends 25% of their time on a campaign, you should attribute 25% of their salary to its cost.
Getting a complete picture of these costs is the only way to understand your true Customer Acquisition Cost (CAC), a vital metric for profitability. If you want to dig deeper, you can check out this detailed guide on customer acquisition cost calculation.
Understanding the "Return" in ROI
Defining your return can be just as tricky as tallying your costs. While direct sales revenue is the clearest form of return, it's often not the whole story, especially for businesses with long sales cycles.
One of the most powerful ways to measure return is by looking at sales growth and calculating Customer Lifetime Value (CLV). The formula is CLV = (Average Purchase Value × Purchase Frequency × Customer Lifespan). This allows you to see the long-term impact of your marketing, not just the initial sale. For instance, acquiring a customer for $300 who makes a single $100 purchase looks bad. But if that customer's CLV is $2,000, that $300 acquisition cost was an excellent investment.
This infographic breaks down the three essential steps for a clear marketing ROI calculation.
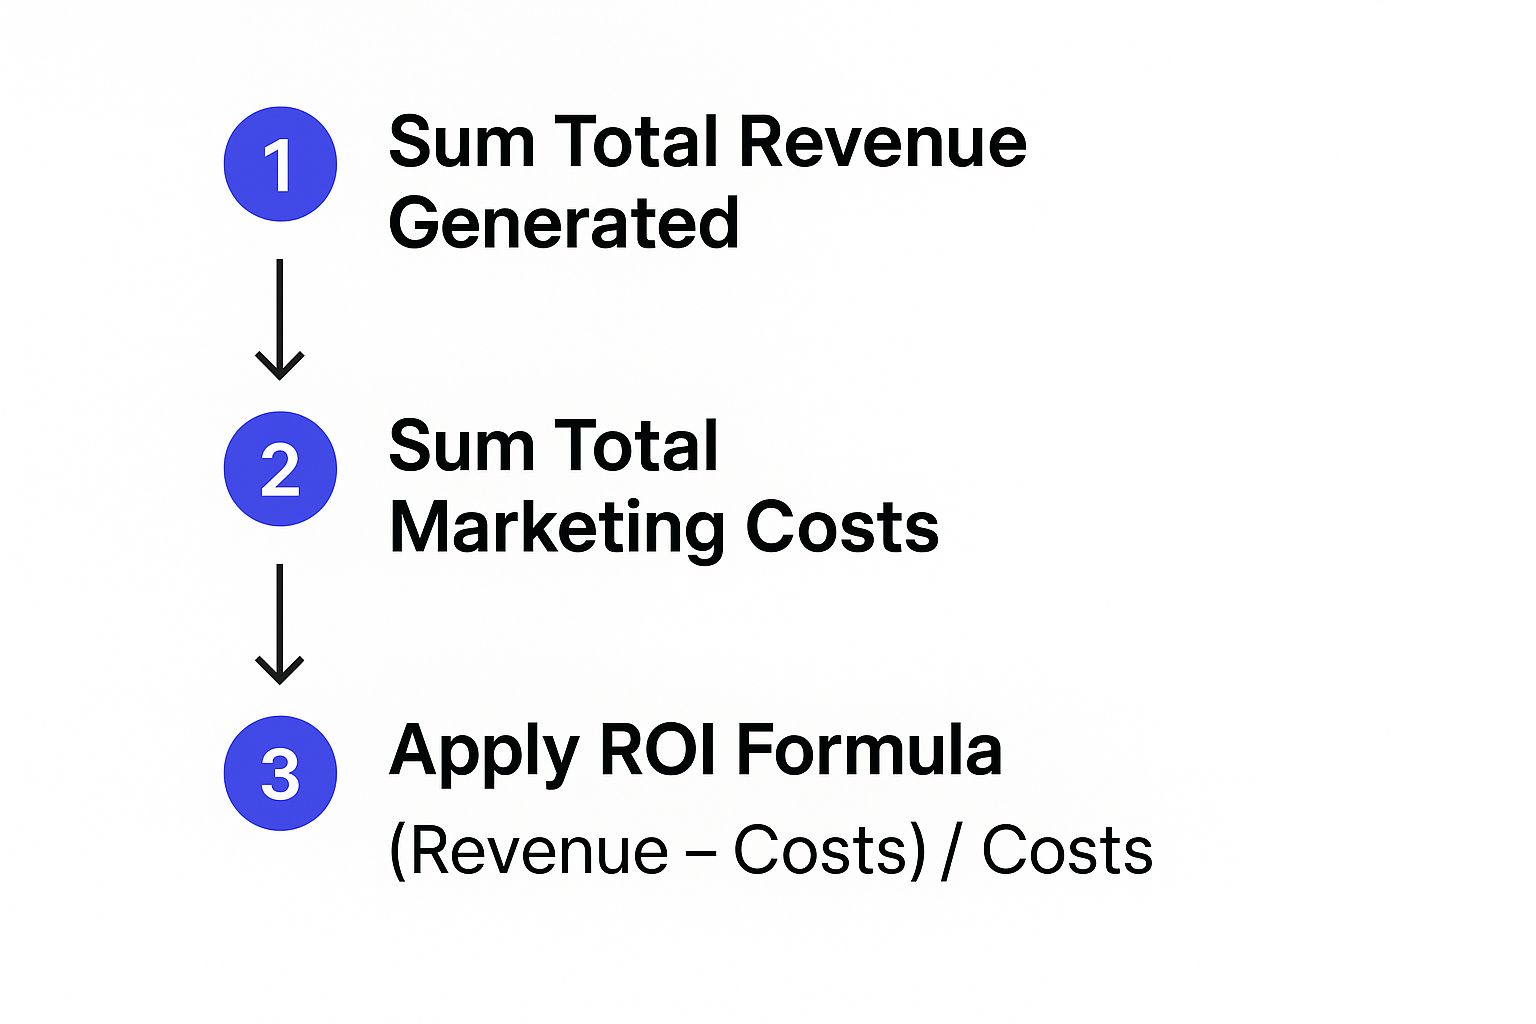
As you can see, getting those revenue and cost inputs right from the start is what makes the final ROI figure trustworthy.
Putting It All Together: A Real-World Example
Let's walk through a scenario. Imagine a B2B software company runs a LinkedIn campaign to get more demo requests.
1. Calculate the Total Marketing Investment:
- Ad Spend: $5,000 on LinkedIn.
- Creative Costs: $1,000 to a freelance designer for the ad visuals.
- Software Costs: $200 for the monthly subscription to their landing page tool.
- Team Costs: The marketing manager (earning $80,000/year) spent about 10 hours on this. Let's break that down: $80,000 / 2080 work hours ≈ $38.50/hour. So, 10 hours x $38.50 = $385.
- Total Investment: $5,000 + $1,000 + $200 + $385 = $6,585
2. Calculate the Return (Net Profit):
- The campaign resulted in 20 qualified demos.
- From those demos, the sales team closed 4 new deals. Each contract is worth $5,000 a year.
- Total Revenue: 4 customers x $5,000 = $20,000
- Now, let's factor in the cost to actually service these customers (Cost of Goods Sold), which is 20% of the contract value, or $1,000 each. Total COGS = 4 x $1,000 = $4,000.
- Net Return: $20,000 (Revenue) – $4,000 (COGS) = $16,000
3. Calculate the Final ROI:
- ROI = ($16,000 – $6,585) / $6,585
- ROI = $9,415 / $6,585 = 1.43
- ROI Percentage = 1.43 x 100 = 143%
What does this mean? For every single dollar they invested in this campaign, they generated $1.43 in pure profit. That's a number you can confidently take to your next meeting. If you're looking for more ways to get these numbers right, check out these proven strategies for measuring marketing effectiveness.
Untangling the Messy Web of ROI and Attribution

Let's be honest, the real world of marketing is messy. A customer's path to purchase is rarely a straight line. They don't just see one ad, click, and buy.
Instead, their journey is a winding road with multiple stops. They might discover your brand through a blog post, see a retargeting ad on Instagram a few days later, get a promotional email, and then finally click a Google ad to make a purchase. According to Google, the average customer journey now involves anywhere from 20 to 500 touchpoints.
This creates a massive headache when you're trying to figure out your marketing ROI. Which one of those channels actually gets the credit for the sale? This is the central question of marketing attribution, and getting the answer right is critical for spending your budget wisely.
Why Your Attribution Model Is a Game-Changer
The attribution model you choose completely shapes your perception of which channels are working. If you pick the wrong one, you could easily end up cutting the budget for a crucial activity just because it doesn't happen right before the checkout page.
Think about it. If you only give credit to the very last touchpoint (a model used by nearly 50% of marketers), your paid search ads might look like they're doing all the heavy lifting. Meanwhile, the content marketing that introduced that customer to your brand in the first place gets completely ignored. This is a common, and very expensive, mistake.
By undervaluing the channels that start the conversation, you risk cutting off the very source of your future customers. A smart attribution strategy helps you see how all your marketing efforts work together to drive real growth.
A Rundown of Common Attribution Models
There are a few different ways to slice this pie, each with its own pros and cons. The trick is to understand what each model tells you and to pick the one that actually fits your business goals and how long it typically takes for someone to become a customer.
-
First-Touch Attribution: This model gives 100% of the credit to the very first interaction a customer has with you. It’s fantastic for figuring out which channels are best at generating initial awareness and bringing new people into your world. If you're focused on top-of-funnel growth, this model can offer powerful insights.
-
Last-Touch Attribution: The exact opposite. This one gives 100% of the credit to the final interaction right before a conversion. While it’s good for pinpointing what closes the deal, it completely overlooks everything that led up to that moment.
-
Linear Attribution: This model spreads the love around, distributing credit equally across every single touchpoint in the customer journey. It's a step up because it acknowledges that multiple interactions matter, but it makes the faulty assumption that they're all equally important.
-
Position-Based (U-Shaped) Attribution: A more nuanced approach. This model gives 40% of the credit to the first touch, 40% to the last touch, and splits the remaining 20% evenly among all the interactions in between. It gives proper weight to both the channel that started the journey and the one that sealed the deal.
Choosing the right model really comes down to knowing your customer. If you have a long B2B sales cycle that averages 90 days, a multi-touch model like position-based will give you a far more accurate picture than a simplistic first- or last-touch model ever could.
Measuring ROI When There's No Immediate Sale
So what about all the brand-building stuff? Things like PR, thought leadership content, or community engagement are notoriously hard to tie directly to a sale, but we all know they have a huge impact.
For these long-haul initiatives, you have to look beyond direct revenue. Instead, you need to track proxy metrics that show your brand's presence and influence are growing.
Key Metrics for Brand Health
- Branded Search Volume: Are more people typing your company's name into Google? That's a rock-solid sign that awareness is on the rise.
- Direct Website Traffic: An uptick in people typing your URL directly into their browser means your brand is memorable.
- Share of Voice: How often is your brand being talked about online compared to your competitors? Tools like Brand24 or Mention can quantify this.
By tracking these metrics over time and lining them up with your brand-building campaigns, you get a powerful, if qualitative, way to see their effect. This is the kind of advanced measurement that separates the good marketers from the great ones. In fact, companies that master data-driven marketing report a 5-8% greater marketing ROI than their peers. You can explore more marketing ROI statistics to see just how much precise data can move the needle.
Even with a solid plan, a few questions always pop up when you get down to the nitty-gritty of measuring marketing ROI. Let's tackle some of the most common ones I hear from teams just starting out.
Think of this as a quick-reference guide to clear up those nagging doubts so you can measure your impact with confidence.
What Is a Good Marketing ROI?
This is the big one, and the honest-to-goodness answer is, "it depends." There's no universal magic number. A "good" return on investment is completely different depending on your industry, the channels you're using, and what you’re trying to achieve.
That said, a common rule of thumb is a 5:1 ratio—that’s $5 in revenue for every $1 you spend. If you're hitting 10:1 or higher, you're in an exceptional spot.
But don't get hung up on those numbers. The most important thing is to figure out what a good ROI looks like for your business. A software company with high profit margins (e.g., 80%) might be thrilled with a 3:1 return. An e-commerce store with razor-thin margins (e.g., 15%), on the other hand, needs a much higher ratio just to stay afloat.
How Often Should I Measure Marketing ROI?
Your measurement schedule should match the pace of the marketing channel you're evaluating. It’s all about finding the right rhythm for your strategy.
- For something fast-moving like a Google Ads campaign, you'll want to check in weekly, or maybe even daily. You need to be ready to make quick adjustments on the fly.
- For your long-game efforts like SEO or content marketing, looking at the numbers monthly or quarterly makes more sense. These strategies are slow burns; they need time to gain momentum. An SEO investment might take 6-12 months to show significant ROI.
The key is to find a consistent cadence. This helps you spot real trends and make smart decisions, rather than getting whiplash from the normal day-to-day ups and downs.
How Do I Measure ROI for Brand Awareness Campaigns?
This is where things get a bit tricky. Brand awareness campaigns are designed to make people remember you, not necessarily to make them buy something on the spot. So, chasing direct revenue here is a recipe for frustration.
Instead, you need to track proxy metrics. These are the breadcrumbs that show your brand's influence is growing.
Keep an eye on upward trends in these areas:
- Direct Website Traffic: Are more people typing your website address directly into their browser?
- Branded Search Volume: Is there a spike in people searching for your brand name on Google?
- Social Media Reach and Engagement: Are your follower counts, shares, and mentions climbing?
- Media Mentions: Are other publications or influencers talking about you more often?
When you see these metrics rise in line with your campaign's timeline, you can confidently connect the dots. It’s all about balancing these long-term brand plays with your direct-response marketing. In fact, research shows that going all-in on performance marketing can actually tank your ROI by 20-50%. Striking the right balance, however, can boost it by 25-100%. You can find more data on balancing marketing investments at amraandelma.com.
Treat brand awareness as the crucial top-of-funnel work that it is. By tracking its leading indicators, you get a much clearer picture of your total marketing impact and avoid undervaluing the efforts that will fuel your growth tomorrow.
Ready to stop guessing and start targeting startups with fresh funding? FundedIQ delivers hand-curated lists of high-intent leads right to your inbox, complete with verified decision-maker contacts and critical buying signals. Spend less time prospecting and more time closing deals with companies ready to invest in growth. Get your first list of funded startups today.