A Founder’s Guide to Startup Equity Data

Think of startup equity data as a company's financial fingerprint. It’s the unique story told through numbers, revealing everything from a startup's health and history to its real growth potential. This data covers all the details behind ownership—valuation, funding rounds, share prices, and dilution. For anyone operating in the startup world, getting a handle on this information is the first step to making smart decisions.
What Is Startup Equity Data and Why It Matters

At its heart, startup equity data answers a few simple but critical questions: who owns what, how much is it worth, and how has that ownership changed over time?
Let's use a practical example. Imagine a startup is a pie. When it's first founded, the two co-founders own the entire pie, split 50/50. To grow, they need capital, so they sell a 20% slice to an investor in a seed round. To attract a crucial lead engineer, they offer a 2% sliver from an employee option pool. Equity data is the detailed ledger that tracks every single one of these slices, making sure everyone knows exactly what they own.
This isn't just about bookkeeping. This data is a powerful tool that brings clarity to a chaotic environment. Founders rely on it to negotiate funding deals and create competitive compensation packages. For example, a founder might analyze data from Carta or PitchBook to see that the median stock option grant for a senior engineer at a Series A company is 0.5%. Investors use it as the backbone of their due diligence, assessing risks and forecasting potential returns. Flying blind without accurate equity data is like trying to navigate a maze in the dark—you're bound to hit a wall.
Key Components of Startup Equity Data at a Glance
Diving into startup equity can feel overwhelming, but it all boils down to a few core concepts. Each metric offers a unique window into a company's financial health and where it's headed. To make it easier, here’s a quick breakdown of what you'll typically find.
| Data Component | What It Reveals | Primary Users |
|---|---|---|
| Valuation | The company's estimated total worth, typically set during a funding round. | Investors, Founders, Job Seekers |
| Funding Rounds | Milestones where capital is raised (e.g., Seed, Series A). Shows momentum. | Investors, Competitors, Agencies |
| Cap Table | A detailed breakdown of who owns what—from founders to the newest hire. | Founders, Investors, Legal Teams |
| Dilution | The percentage decrease in ownership when new shares are issued. | Founders, Employees, Early Investors |
These components don't exist in a vacuum; they all interact with one another. A sky-high valuation might grab headlines, but if it comes with massive dilution, an early employee's stake could end up being worth less than they hoped. For example, owning 1% of a $10M company is better than owning 0.5% of a $15M company. It's the interplay between these numbers that tells the real story.
For many people, equity is the single biggest reason to take the risk of joining an early-stage company. A seemingly small percentage can turn into a life-changing amount of money if the company succeeds, but it becomes completely worthless if it fails. To get a better sense of the odds, it's worth exploring the latest startup failure statistics and understanding why so many ventures don't make it to the finish line.
Decoding the Core Components of Startup Equity
To really understand the story startup equity data tells, you need to speak its language. A startup's entire journey—its past, present, and potential future—is written in a few key terms. Once you get these down, you can start putting the data to work.
Think of these components as a company's vital signs. A doctor checks your pulse and blood pressure to see how you're doing. In the same way, investors and founders look at a startup's valuation, cap table, and dilution to get a clear picture of its financial health.
Each piece of the puzzle connects to the others, so let's break them down one by one.
Valuation: The Company's Price Tag
At its core, valuation is just the agreed-upon worth of a startup during a funding round. It’s not a number pulled out of a hat. Founders and investors negotiate it based on real factors like the size of the market, the team’s track record, early sales (e.g., Annual Recurring Revenue or ARR), and competitive multiples. For example, a SaaS company with $1M in ARR might be valued at 10x its revenue, or $10M.
You’ll always hear two terms thrown around here: pre-money and post-money valuation.
- Pre-Money Valuation: This is what the company is considered to be worth before an investor puts a single dollar in. It's a snapshot of its value based on all the progress made so far.
- Post-Money Valuation: This is the value after the new investment cash is in the bank. The math is simple: Pre-Money Valuation + Investment Amount = Post-Money Valuation.
Let's use a quick example. A startup called "Innovate Inc." needs cash to scale. An investor agrees the business is worth $8 million as it stands today—that's the pre-money valuation.
The investor then writes a check for $2 million. The post-money valuation instantly becomes $10 million ($8M + $2M). This calculation is critical because it determines how much of the company the new investor gets. In this scenario, their $2 million investment just bought them 20% of a fresh $10 million company ($2M investment / $10M post-money).
The Capitalization Table: The Shareholder Scoreboard
The capitalization table, or cap table for short, is the definitive record of who owns what. Think of it as the official scoreboard for all shareholders, listing every person and fund with a piece of the company and exactly what percentage they hold.
A cap table is a living document. It might start with just a couple of founders. But with every new hire who gets stock options from the employee option pool (typically 10-15% of total equity) and every new funding round, the table grows and gets more complicated.
A clean cap table is the single source of truth for ownership. It keeps everyone on the same page and prevents nasty surprises or disputes down the line, especially when it's time to raise more money, sell the company, or go public.
Keeping an accurate cap table isn't just good housekeeping; it’s non-negotiable. Any serious investor will pour over it during due diligence to confirm who owns what and to understand the company's financial history.
Dilution: Slicing the Pie Differently
Dilution might be the most misunderstood concept in the startup world. All it means is that an existing shareholder's ownership percentage goes down when the company issues new shares.
The pie analogy works perfectly here. Imagine you and a friend bake a pie and you own 50%. You bring in an investor who buys 20% of the company. To do this, new shares are created, and the total number of shares increases. Your 50% stake might shrink to 40%. You've been "diluted."
That’s exactly what happens when a startup raises money. It creates new shares for the new investor, which increases the total number of shares and shrinks everyone else's percentage.
But dilution isn’t necessarily a bad thing. While your ownership percentage gets smaller, the goal is for the new investment to make the entire company much more valuable. Owning 20% of a $10 million company ($2M value) is a lot better than owning 25% of an $8 million company ($2M value) that's about to run out of money. The whole point is to own a smaller slice of a much, much bigger pie.
How Global Trends Shape Valuations and Funding
A startup's equity story is never written in a vacuum. It’s deeply connected to the global economic stage, where things like investor confidence, market stability, and regional trends are constantly changing the script. In fact, startup equity data looks wildly different from one continent to the next, proving that where you build your company is a powerful variable in the valuation equation.
Think about it this way: imagine two identical SaaS startups. Both have $1M in ARR. One is based in Silicon Valley, the other in an emerging tech hub in Southeast Asia. The Silicon Valley company will almost always command a higher valuation—perhaps 10-15x ARR versus 5-8x ARR for its counterpart. Why? It's swimming in a dense ecosystem with fierce competition for deals, more capital floating around, and a long track record of massive exits. That environment just creates a higher baseline for what investors are willing to pay.
This isn't just theory; it shows up in the hard numbers. A company’s bargaining power, the amount of cash it can raise, and how much ownership the founders have to give up are all shaped by these powerful, external forces. Getting a handle on this context is critical, whether you're a founder mapping out your fundraising strategy or an investor hunting for the next big thing.
The Global Shuffle in Early-Stage Funding
The global funding landscape is anything but static. Investor sentiment can pivot on a dime, redirecting capital flows and rearranging the pecking order of tech hubs. A quick look at recent pre-seed startup equity data shows just how much of a reshuffling has been going on.
In the first half of 2025, the United States held onto its top spot with an average pre-seed valuation of $5.27 million and a typical dilution of 19.69%. But the real story was the Middle East, which surged past Europe to claim second place. It boasted a hefty $3.7 million average valuation, though it came at the cost of the highest average dilution at a steep 24.8%.
Oceania also leapfrogged Europe with a $3.32 million average valuation and a much more founder-friendly dilution rate of 11.67%. Europe, meanwhile, slipped to fourth with a $3.24 million valuation and 21% dilution. At the other end of the spectrum, Latin America, Southeast Asia, and Africa saw valuations clustered between $2.08 million and $2.28 million. These numbers aren't just trivia; they reflect how regional economic growth and the maturity of the local ecosystem create completely different fundraising dynamics.
This data paints a vivid picture of how a founder's journey can be radically different depending on their zip code. An entrepreneur in the Middle East might land a great valuation but will likely hand over a bigger slice of their company to do it. On the other hand, a founder in Oceania could raise capital with less dilution, simply because of different investor expectations and market pressures.
Key Factors Influencing Regional Differences
So, what’s driving these big gaps in valuation and funding around the world? A few core elements are constantly at play, acting as invisible forces that either pump up or push down a startup's perceived value.
- Investor Confidence: Regions with stable economies and a history of successful IPOs or acquisitions naturally attract more risk-tolerant capital. For instance, the sheer number of billion-dollar exits from Silicon Valley historically fuels higher-risk, higher-valuation investments.
- Ecosystem Maturity: Established tech hubs like Silicon Valley, New York, and London have deep talent pools, seasoned mentors, and a network of serial entrepreneurs. An investor in Tel Aviv knows the founder can easily hire engineers with experience scaling a company from 10 to 1,000 employees.
- Regulatory Environment: Government policies around taxes, intellectual property, and business formation can either roll out the red carpet for startups or create frustrating roadblocks. Singapore's friendly tax incentives and government grants have made it a magnet for startups in Southeast Asia.
- Market Size and Access: Startups in massive, unified markets like the U.S. or China often have a clearer, faster path to scaling up. That potential makes them far more attractive than companies in smaller, fragmented regions.
These regional trends are not just statistics; they are strategic guideposts. For a founder, they inform fundraising expectations. For an investor, they highlight undervalued markets and emerging opportunities.
These regional differences also show up in who gets funded. Different global markets have unique patterns in how capital is spread across diverse founding teams. You can explore this further by looking at comprehensive startup diversity statistics.
Using predictive analytics can offer a crucial glimpse into how these global trends might impact future valuations and funding rounds. By analyzing historical data and current market signals, both founders and investors can get ahead of shifts in investor appetite and position themselves for success. It’s all about turning raw data into a real strategic advantage.
Navigating Equity Data Through Funding Stages
A startup’s journey is a story told in funding rounds, and its startup equity data is the script. Each new stage, from a hopeful Pre-Seed idea to a high-growth Series C powerhouse, completely changes the company's valuation, capital needs, and how much ownership the founders retain. If you're involved in any capacity, you need to understand this evolution—the stakes get higher with every milestone.
Think of a startup's growth like building a skyscraper. The Pre-Seed and Seed rounds are the foundation, costing a few hundred thousand to a couple of million dollars. These are smaller, critical investments meant to prove the architectural plans are sound. Once the company proves its model, later rounds like Series A and B add more floors, requiring way more capital—tens of millions—to reach new heights.
This progression isn't just about bigger checks; it shows a strategic shift. Early funding is a bet on a vision. Later-stage funding is an investment in a proven, scaling machine. The equity data at each step gives you a clear snapshot of this transformation.
From Proving a Concept to Scaling an Empire
The financial DNA of a startup changes dramatically from one round to the next. What starts as a small cash injection to build a minimum viable product can quickly balloon into a multi-million-pound operation with serious overhead.
Equity data shows these growing pains clearly, revealing capital needs and typical dilution patterns. The average funding amounts jump significantly at each stage: Seed rounds usually land between £500,000 to £2 million, while Series A averages £15 million. By the time a company hits Series B, it's typically raising £20-£30 million, and a Series C can scale to about £68 million. To put that in perspective, almost half (47%) of Series A startups are already burning through upwards of £400,000 a month, which highlights just how critical securing enough capital is.
The table below breaks down what you can generally expect at each stage.
Typical Startup Funding Stages and Equity Metrics
| Funding Stage | Average Funding Amount | Typical Valuation Range | Primary Goal |
|---|---|---|---|
| Pre-Seed | £50k – £250k | £100k – £2M | Validate the idea, build a minimum viable product. |
| Seed | £500k – £2M | £2M – £10M | Achieve product-market fit, build the initial team. |
| Series A | £2M – £15M | £10M – £40M | Optimize the business model, scale user acquisition. |
| Series B | £20M – £30M | £40M – £150M | Expand market share, grow the team aggressively. |
| Series C | £50M+ | £150M+ | Prepare for IPO or acquisition, achieve profitability. |
As you can see, the goals—and the money required to achieve them—evolve rapidly. It’s a marathon, not a sprint.
Understanding the Terms of Engagement
As startups climb these funding ladders, the deals get a lot more complicated. Founders have to get fluent in the language of venture capital to protect their ownership and guide their company's financial future. The agreements signed in these rounds dictate control, returns, and the rules of the game for years to come.
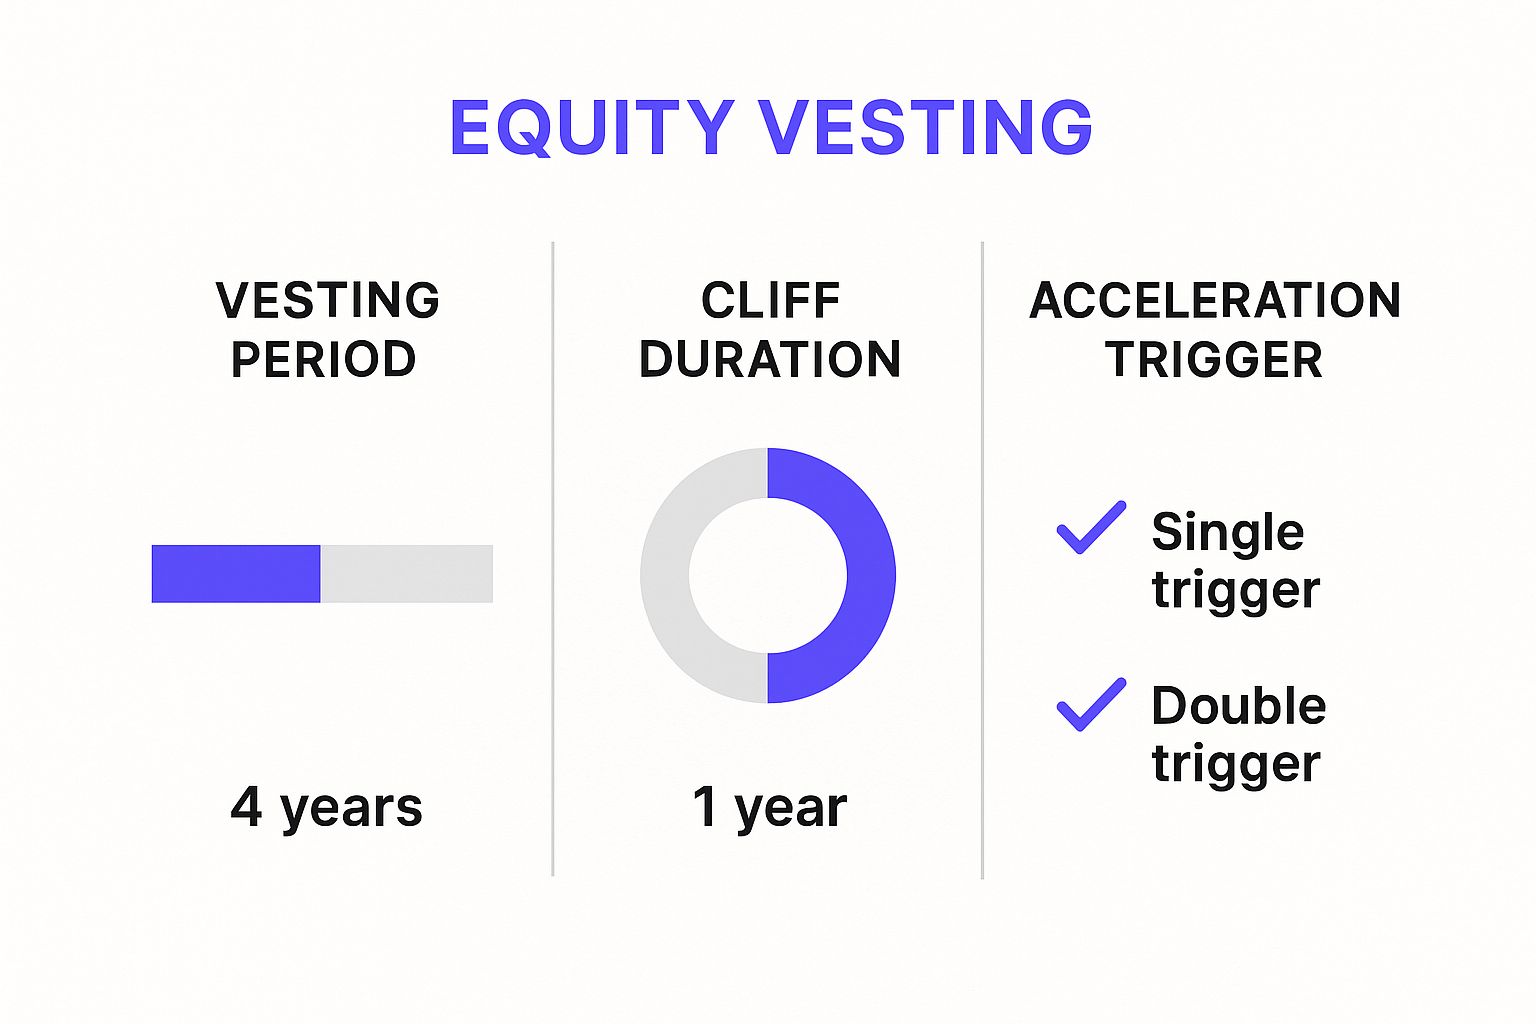
The image above highlights common terms like vesting schedules and cliffs, which are standard practice. A typical four-year vesting schedule with a one-year cliff is designed to make sure employees and founders stick around for the long haul.
But there's much more to it than that. For instance, the term sheet is the blueprint for the investment. It lays out everything from valuation and the investment amount to investor rights like board seats and liquidation preferences. A poorly understood term sheet can lead to a massive loss of control or nasty financial surprises down the road. For example, a "3x participating preferred" liquidation preference could mean an investor gets 3x their money back plus their ownership share in an exit, leaving little for founders and employees.
As startups mature, knowing the ins and outs of these agreements is essential. Resources like a founder's guide to the venture capital term sheet are invaluable for cutting through the legal jargon. This knowledge empowers founders to negotiate from a position of strength, striking the right balance between raising capital and retaining control to build their vision.
Putting Startup Equity Data into Action

Knowing what startup equity data is made of is one thing, but its real magic happens when you actually use it. For anyone in the startup world, this data isn't just a spreadsheet of numbers—it's a strategic weapon that gives you a serious competitive edge. It turns fuzzy market trends into sharp, actionable insights you can build a business on.
Think of it like a weather forecast for a sailor. Raw data about wind speed and ocean currents is interesting, sure. But its true value is revealed when the captain uses it to chart a course, dodge a storm, and reach their destination faster and safer. In much the same way, founders, investors, and even job seekers rely on equity data to navigate their own journeys with more confidence.
Let's walk through a few real-world scenarios to see how this plays out. You'll quickly see how this information drives critical decisions that can make or break a company, a deal, or a career.
For Founders Benchmarking for Success
Picture this: you're the founder of an early-stage SaaS startup. You’ve finally nailed product-market fit and you're getting ready for your Series A funding round. In your gut, you feel your company is worth $25 million, but how can you know for sure? This is where competitive startup equity data becomes your best friend.
By digging into the valuations, funding totals, and dilution percentages of similar companies in your space, you can ground your expectations in reality. You might find that competitors with similar annual recurring revenue (ARR) and growth rates recently closed their rounds at valuations between $20 million and $22 million.
Suddenly, you have a solid, evidence-based anchor for your investor conversations. Instead of walking in with a number you just feel is right, you can present a case built on real-world comps. For example: "Similar companies at our stage, like Competitor X and Competitor Y, raised at an 8x ARR multiple. Based on our current $2.5M ARR, we believe a $20M valuation is right in line with the market." This does more than just strengthen your negotiating hand; it shows investors you've done your homework, building instant credibility.
For a founder, equity data is a mirror reflecting the market's perception of value. It helps you understand not just what you think you're worth, but what investors are actually willing to pay, preventing you from either undervaluing your hard work or overpricing yourself out of a deal.
For Investors Conducting Due Diligence
Now, let's flip the script. You’re a venture capitalist who just heard a pitch from that same SaaS founder. The story is slick and the team seems solid, but your job is to look beyond the pitch deck and really kick the tires. For you, startup equity data is the bedrock of your due diligence.
You’d immediately dive into the cap table to see who owns what. A messy cap table cluttered with too many tiny, early investors can be a huge red flag, hinting at governance nightmares down the line. Next, you'll scrutinize their funding history to map out the company's valuation trajectory over time. A healthy trajectory might look like this: Seed round at $5M, Series A at $20M, Series B at $80M.
Did the valuation climb steadily with each previous round, or was there a flat or "down round" that might signal deeper issues? This financial history tells a story the founder's pitch might conveniently leave out. By comparing the startup’s metrics against industry benchmarks, you can more accurately assess risk and model potential returns, turning a good story into a data-backed investment.
For Agencies and Recruiters Identifying Growth
For marketing agencies and recruiters, startup equity data is basically a high-powered lead generation machine. A fresh funding announcement is one of the loudest buying signals a company can make. It means they’re flush with cash and have an immediate need to spend it on growth—whether that means hiring new talent, launching a marketing blitz, or adopting new tech.
Just look at the recent trends. In April 2025, the AI and quantum computing company SandboxAQ raised a massive $150 million, bringing its total equity funding to $950 million. Around the same time, fintech firm Thunes also raised $150 million, pushing its total funding to $1.3 billion. These aren't just headlines; they are giant, flashing "buy now" signs. A marketing agency seeing this knows that SandboxAQ likely has a new multi-million dollar marketing budget to spend.
Recruiters can use this same data to find companies that are about to go on a hiring spree. A creative studio sees a company with a full war chest and knows a major rebrand is likely on the horizon. A proactive approach like this gets you in the door right when they need you the most. For a ready-made list to get you started, you can check out this free funded startups list.
Common Questions About Startup Equity Data
Diving into the world of startup equity data can feel like learning a new language. The terms are specific, the numbers are big, and the stakes are high for everyone involved—from founders to the newest hire.
Let's break down some of the most common questions people have. These answers will clear up the confusion and give you the confidence to talk about equity like a pro.
How Is a Startup's Pre-Money Valuation Determined?
You might think there’s a secret formula for this, but a startup's pre-money valuation is really more art than science. It's not calculated; it's negotiated.
Founders and investors come to the table and hash it out based on several key factors: the size of the potential market, the team's track record, any early traction like revenue or user growth, and what similar companies are worth. For a SaaS company, a common method is applying a multiple to its Annual Recurring Revenue (ARR). For example, if comparable companies are being valued at 8-10x ARR, a startup with $500,000 in ARR might negotiate a pre-money valuation of $4-5 million.
What Is the Difference Between Common and Preferred Stock?
This is a critical distinction that shapes the entire cap table. The two types of stock are not created equal.
- Common Stock: Think of this as the standard-issue stock. It's what founders and employees typically hold through stock options. If the company is sold for $100 million, a common stockholder with 1% ownership gets $1 million, but only after preferred stockholders are paid.
- Preferred Stock: This is the class of stock usually given to investors. It's "preferred" because it comes with special perks, like getting their money back first if the company is sold (liquidation preference) and protections against their ownership stake getting watered down in future rounds.
How Much Dilution Is Normal in an Early Funding Round?
While there's no single magic number, most early-stage funding rounds (like a Seed or Series A) see founders giving up between 15% and 25% of the company.
It’s a strategic tightrope walk for founders. You need to raise enough cash to hit your next big goal, but you also want to hold onto as much ownership as possible. If a founder gives up 30% in a Seed round and another 25% in a Series A, their ownership stake can quickly drop below 50%, potentially impacting their control over the company. Finding that sweet spot is key to fueling growth without giving away the farm too early.
The most frequently used vesting structure in the startup world is a four-year vesting period with a one-year cliff. Data shows that 62% of European tech companies follow this model, making it the clear industry standard.
What Is the Purpose of a Vesting Schedule?
A vesting schedule is the company's way of making sure equity is earned, not just given. It aligns everyone's incentives by rewarding long-term commitment.
The most common setup is a four-year schedule with a one-year "cliff." This means you have to stay with the company for at least one year before you get any of your promised equity. On your one-year anniversary, 25% of your shares "vest". After that one-year mark, your remaining shares typically start vesting each month for the next three years. It's a system designed to make sure equity goes to the people who stick around and help build the company.
Ready to turn funding announcements into your next big client? FundedIQ delivers a hand-curated list of recently funded startups with verified decision-maker contacts directly to your inbox every month. Stop chasing cold leads and start engaging high-intent prospects at the perfect moment. Explore FundedIQ today.