What Is Revenue Forecasting and Why It Matters
- From Educated Guess to Strategic Blueprint
- Why Accurate Forecasting Is Your Business Superpower
- Picking the Right Forecasting Model for Your Agency
- How AI Is Changing the Game in Revenue Forecasting
- Building a Reliable Forecasting Process
- Avoiding Common Forecasting Pitfalls
- A Few Final Questions About Revenue Forecasting
Think of revenue forecasting as your business's financial GPS. It’s the process of looking at where you've been and what's happening now to predict how much money you'll bring in over a specific timeframe, like the next quarter or the coming year. This isn't just about pulling numbers out of thin air; it’s a calculated estimate based on historical data, your current sales pipeline, and what's going on in the market. According to a study by Ventana Research, companies that have a structured forecasting process are 10% more likely to grow revenue year-over-year.
Ultimately, this projection becomes your strategic guide. It’s the document you turn to when making big decisions about your budget, where to put your resources, and how to plan for growth.
From Educated Guess to Strategic Blueprint
Imagine trying to drive across the country without a map or GPS. You might have a vague sense of which way is west, but your journey would be a messy collection of wrong turns and guesswork. That’s exactly what running a business without a solid revenue forecast feels like.
At its heart, revenue forecasting is about creating that map. It takes your big, ambitious goals and translates them into a clear financial story, giving you a tangible roadmap for the future. Think of it less like trying to see the future in a crystal ball and more like a meteorologist predicting the weather. You’re using past data, current conditions, and proven models to make a highly informed prediction about what’s on the horizon.
The Foundation of Smart Decisions
An accurate forecast isn't just a nice-to-have; it's the bedrock of smart, confident decision-making. Nearly every strategic move you make, from hiring to marketing spend, should be informed by it. Without a forecast, you’re flying blind.
For instance, a dependable forecast helps you:
- Allocate Resources Effectively: A SaaS company might use its forecast to decide it can afford to hire two new developers in Q3 to build a requested feature, timing the expense with an expected revenue increase from a new pricing tier.
- Manage Cash Flow Proactively: By anticipating the natural peaks and valleys of your revenue, you can make sure you always have enough cash on hand to cover expenses and jump on unexpected opportunities. A seasonal retail business, for example, can secure a line of credit before the slow summer months, based on a forecast predicting a temporary dip.
- Set Realistic Goals: It aligns your entire team—from sales quotas to marketing targets—around a single, achievable vision of success. This prevents setting impossible targets that demotivate staff or sandbagging goals that don't push the company forward.
- Secure Investment: Nothing shows potential investors you have a solid plan like a well-researched forecast. It proves you have a clear, data-driven path to profitability. Venture capitalists often state that a credible, detailed forecast is a top-three factor in their funding decisions.
To build a reliable forecast, you need to understand its core ingredients. Each piece plays a critical role in painting an accurate financial picture.
Key Components of a Revenue Forecast
| Component | Description | Example |
|---|---|---|
| Historical Data | Past sales figures and revenue trends from previous months, quarters, or years. | A B2B firm analyzes the last 36 months of sales data and finds a consistent 15% revenue drop every August, allowing them to plan for it. |
| Sales Pipeline | The current status of all your potential deals, including their value and likelihood of closing. | Your CRM shows 5 deals in the final negotiation stage worth a combined $100,000, with a historical close rate of 80% at this stage, leading to a weighted forecast of $80,000. |
| Market Trends | External factors like industry growth, economic conditions, and competitor activity. | A new data privacy law (like GDPR) is being introduced, so a marketing tech company forecasts a temporary 10% dip in sales as clients pause to assess compliance. |
| Time Period | The specific duration the forecast covers, such as a month, quarter, or fiscal year. | Creating a forecast specifically for Q3 (July 1 – September 30). |
| Assumptions | Documented beliefs about internal and external factors that could impact revenue. | Assuming your top salesperson will hit 110% of their quota based on past performance and that the new marketing campaign will generate 500 MQLs with a 5% conversion rate. |
Each of these elements works together, turning what could be a simple guess into a strategic asset for your business.
From Simple Lines to Dynamic Models
In the past, many companies got by with very basic models. A common method was the "straight-line" forecast, which just assumes a steady growth rate based on previous performance. For example, if you made $100,000 in revenue last year and grew by 30%, a straight-line forecast for this year would simply be $130,000.
But the business world is rarely that simple. This method fails to account for seasonality, one-off projects, or market volatility. Modern forecasting has moved far beyond these old-school calculations. Today, it’s a dynamic process that pulls in data from multiple sources to create a much more nuanced and accurate picture.
To make the leap from rough estimates to a true strategic blueprint, many agencies now rely on dedicated platforms. Tools from providers like growth-grid.ai help integrate growth planning and real-time analytics, turning a once-static spreadsheet exercise into a powerful tool for navigating the market with confidence.
Why Accurate Forecasting Is Your Business Superpower

A solid forecast is so much more than just numbers in a spreadsheet; it’s a genuine strategic advantage. Think of it as the difference between sailing with a detailed nautical chart versus trying to navigate the open ocean completely blind. When you have that clear financial map, you can make bold, calculated decisions that steer your business toward growth, rather than just reacting to whatever the market throws at you.
This ability to see what's coming changes everything. Instead of guessing when to make a big move, you can strategically green-light a new marketing campaign or bring on that star employee at the exact right moment. Every major decision is backed by data, not just a gut feeling.
Fueling Confident Decisions
A reliable forecast gives you the power to put your resources where they’ll have the most impact. Once you have a clear picture of your future income, you can confidently invest in the very activities that fuel growth. This foresight lets you shift from playing defense to playing offense, jumping on opportunities before your competitors even see them coming.
For instance, knowing a strong quarter is on the horizon allows a marketing agency to double down on ad spend when it really counts. To dive deeper into this, check out our guide on how to measure marketing ROI. This proactive approach, all guided by your forecast, makes sure your investments are both timely and effective.
This strategic thinking applies to every corner of your business:
- Hiring: A software company forecasts hitting a key MRR milestone in six months. They can start the three-month hiring process for a senior engineer now so the new hire is onboarded and ready to contribute right as the growth hits.
- Expansion: A forecast predicting sustained demand in a new region provides the hard data needed to justify opening a local office, transforming an educated guess into a calculated business case.
- Technology: An e-commerce business forecasts a 50% increase in holiday traffic. This justifies upgrading their server infrastructure in October to prevent website crashes on Black Friday, protecting revenue and brand reputation.
Aligning Teams and Attracting Investment
Beyond just internal planning, an accurate forecast is one of the most powerful tools you have for winning outside support. Whether you're pitching to investors or applying for a loan, a well-researched forecast proves you have a clear vision and a believable plan for achieving profitability. It tells them you know your market inside and out.
An accurate revenue forecast bridges the gap between ambition and execution. It aligns sales, marketing, and finance around a single source of truth, creating organizational clarity and shared accountability for hitting targets.
Getting everyone on the same page is crucial. A study by the Aberdeen Group found that companies with accurate sales forecasts are 7.3% more likely to hit their quotas. Using effective methods like sales pipeline analysis helps businesses look at active leads, conversion rates, and deal sizes to get a real-time snapshot of future revenue. With that information, companies can set realistic sales targets and make sure every department is pulling in the same direction.
Ultimately, businesses that get forecasting right can navigate their future with confidence. They trade the sleepless nights spent worrying about cash flow for a data-backed strategy that paves the way for sustainable growth.
Picking the Right Forecasting Model for Your Agency
Choosing a revenue forecasting model is a lot like picking a navigation app. A simple map might work for a walk around the block, but you'll need a dynamic, real-time GPS for a cross-country road trip with unpredictable traffic. The right method for your agency depends entirely on your business stage, your industry, and, most importantly, the quality of the data you have on hand.
There's no magic bullet here. The real goal is to find the approach that gives you the most trustworthy picture of the future. The model you choose will shape your predictions, and by extension, the strategic bets you make on hiring, spending, and growth.
Foundational Models: Looking Back to See Ahead
For agencies with a few years of consistent performance under their belt, historical models are a solid place to start. These methods are all about looking backward to predict the future, using your past revenue as the main clue for what’s coming next.
They're straightforward and easy to implement. Two of the most common are:
- The Straight-Line Method: This is forecasting at its simplest. You take your revenue from a previous period, say last year, and apply the same growth rate moving forward. If you grew by 15% last year, you pencil in another 15% increase for the next. It’s a good fit for highly predictable businesses but can completely miss sudden market shifts. For example, a commercial cleaning company with long-term contracts might use this effectively.
- The Moving Average Method: This approach smooths out the bumps in your revenue data. Instead of just looking at one past period, it averages your revenue over several recent ones (like the last three or six months). This gives you a more balanced view and is especially useful for agencies that deal with some seasonality but not wild swings. A marketing agency that sees project revenue fluctuate month-to-month would find this more reliable.
While these models are great for their simplicity, they operate on one big assumption: that tomorrow will look a lot like yesterday. When things are changing fast, you'll need to look beyond just your history.
As the data below shows, getting this right has a real, tangible impact.
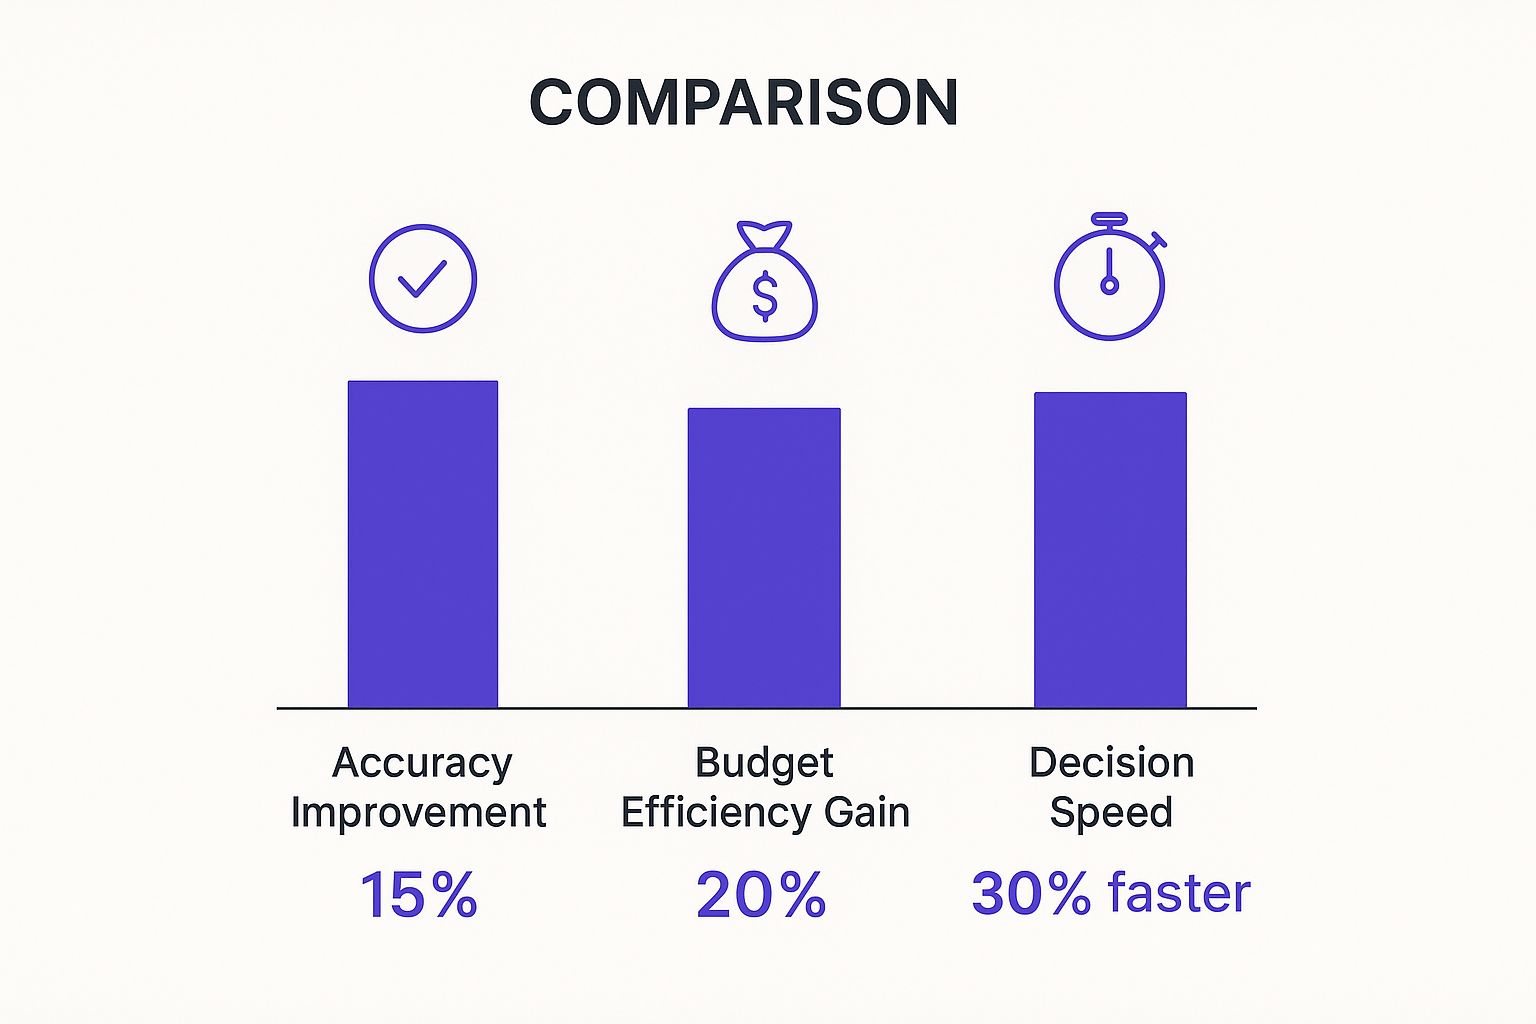
This isn't just about making prettier charts. Better forecasting leads directly to smarter, faster decisions, more effective budget allocation, and a significant jump in overall accuracy. It’s about building confidence in your numbers.
Dynamic Models: Forecasting in Real Time
What happens when your past performance isn't a reliable guide? That’s where dynamic, forward-looking models come in. These methods ditch the rearview mirror and focus on what's happening right now, incorporating multiple variables to paint a much richer picture of the future.
The most effective revenue forecasting doesn't just look at what happened; it analyzes what is happening now to predict what will happen next. It connects sales activity directly to financial outcomes.
Pipeline-based forecasting is a non-negotiable for any agency with a sales team. Instead of just extrapolating from past revenue, this model digs into your active sales pipeline. You look at every potential deal and assign a probability of it closing based on where it is in your sales process. For instance, a deal that’s reached the "Proposal Sent" stage might have a 70% chance of closing, while one you just made "Initial Contact" with might only have a 10% chance. Sum it all up, and you have a forecast grounded in your team's current efforts.
Another powerful method is multi-variable analysis. This is a more sophisticated approach where you consider several different factors—both internal and external—that could push your revenue up or down. A B2B agency, for example, might build a model that looks at lead volume from different channels (e.g., website, referrals, paid ads), historical conversion rates for each channel, and the average contract value. This gives you a much deeper understanding of the levers you can actually pull to drive growth.
In the end, it’s all about picking a model that reflects how your business actually works and gives you insights you can act on.
Comparison of Revenue Forecasting Methods
To help you decide which approach might be the best starting point, we've broken down the most common methods in the table below. Each one has its place, and the best choice often depends on your agency's maturity and the data you have available.
| Method | How It Works | Best For | Pros | Cons |
|---|---|---|---|---|
| Straight-Line | Applies a flat, historical growth rate to a previous period's revenue. | Stable, highly predictable businesses with consistent growth patterns. | Simple to calculate; requires minimal data. | Inflexible; ignores seasonality and market changes. |
| Moving Average | Averages revenue over a specific number of past periods (e.g., 3, 6, or 12 months). | Businesses with some seasonality or minor revenue fluctuations. | Smooths out random spikes or dips; more balanced than straight-line. | Lags behind recent trends; less accurate during rapid change. |
| Pipeline-Based | Calculates expected revenue by applying a win-probability percentage to each deal in the sales pipeline. | Sales-driven organizations, especially in B2B, SaaS, and agency settings. | Forward-looking; directly tied to current sales activity. | Requires a well-managed CRM and accurate stage probabilities. |
| Multi-Variable Analysis | Uses statistical models (like regression) to predict revenue based on multiple independent variables. | Mature businesses with rich historical data and a clear understanding of their growth drivers. | Highly accurate; reveals which factors most impact revenue. | Complex to set up and maintain; requires data science expertise. |
As you can see, the simpler methods are easier to get up and running, but the more dynamic models provide a far more nuanced and actionable forecast. Many mature agencies end up using a hybrid approach, combining insights from several models to get the most complete picture.
How AI Is Changing the Game in Revenue Forecasting
The next big leap in forecasting is already here, and it's all about artificial intelligence and machine learning. These aren’t just buzzwords; they represent a fundamental shift away from traditional models. We're moving toward a much more dynamic, precise, and nimble way of predicting what’s coming down the revenue pipeline.
Instead of simply extrapolating from past sales figures, AI models can chew through massive, diverse datasets in real time. They spot hidden patterns, subtle seasonal shifts, and new market trends that a human analyst—or a spreadsheet formula—would almost certainly miss. This is what turns revenue forecasting from a rearview-mirror exercise into a genuine competitive advantage.
Going Deeper with Machine Learning
Think of AI-driven forecasting as upgrading from a simple calculator to a supercomputer. While old-school methods might rely on a handful of variables, machine learning algorithms can analyze hundreds, even thousands, of data points at once.
This gives you a much richer picture of what’s actually driving revenue. An AI model can connect the dots between a competitor’s new pricing strategy, a spike in social media chatter, and macroeconomic shifts to predict their combined effect on your next quarter's sales.
Here’s what that looks like in the real world:
- An e-commerce brand can use AI to analyze web traffic, cart abandonment rates, and even local weather data to predict demand for certain products, which helps them nail their inventory. A real-world example is Amazon, which uses predictive analytics to pre-position products in warehouses closer to customers before they even order them.
- A SaaS company can use machine learning to spot subtle user behaviors that signal a high risk of churn (e.g., decreased login frequency, ignored feature updates), allowing the model to project the direct impact on monthly recurring revenue. This enables proactive customer success outreach.
AI doesn't just make forecasts more accurate; it changes the kinds of questions you can ask. Instead of asking, "What will our revenue be?" you can start asking, "What will our revenue be if we launch this feature and a competitor drops their price next month?"
Better Accuracy and Real-Time Adjustments
Bringing machine learning into the forecasting process is already paying off. We’re seeing global businesses adopt AI models that sift through historical sales, market trends, and customer behavior to create incredibly detailed predictions. For instance, some enterprises using major AI platforms have managed to slash their forecast errors by as much as 5-10%.
This boost in accuracy comes from the system's ability to learn and adapt on the fly. As new data streams in, the model continuously refines its own algorithms, getting smarter and more precise over time. Of course, to make this work, you need solid data pipelines. Having things like real-time data streaming for AI and low-latency analytics is key to feeding these models the fresh information they need.
The end result is a forecast that isn't just a static report but a living, breathing prediction that adjusts as your business environment changes.
Building a Reliable Forecasting Process
A killer forecasting model is worthless without a solid process to back it up. Think of it this way: a world-class chef can't make a gourmet meal in a dirty kitchen with spoiled ingredients. Your business needs a structured process and clean data to cook up a forecast you can actually trust. This isn't just a stressful quarterly chore; it's your blueprint for continuous strategic planning.
Everything starts with your data. Seriously. Bad data is the single biggest poison to a good forecast. IBM estimates that poor data quality costs the U.S. economy $3.1 trillion annually. That's how much is at stake. So, get your CRM in order. Keep it updated, hunt down and merge duplicates, and make sure everyone follows the same rules for entering information.
A reliable forecast isn’t built on one person’s gut feeling. It’s the result of sales, marketing, and finance sharing insights and holding each other accountable.
Getting everyone on the same page isn't just a nice-to-have; it's the only way to build a projection that reflects reality.
Fostering Cross-Functional Alignment
Forecasting is a team sport, not a solo mission. Each department brings a crucial piece of the puzzle. Sales has the on-the-ground intel on how deals are really progressing. Marketing knows all about lead quality and which campaigns are hitting the mark. Finance provides the historical context and keeps everyone grounded in financial reality.
For this collaboration to work, you need one single source of truth—and that’s almost always your CRM. It’s the central hub where all deal information lives, making it easy to track progress and stay aligned. If you want to get this foundational piece right, our guide on what is sales pipeline management is a great place to start. A well-structured pipeline ensures everyone is playing from the same sheet of music.
Setting a Cadence for Review and Refinement
Your forecast isn't a statue you build and admire from afar. It's a living document. The market moves way too fast for a "set it and forget it" mindset. You need a regular review cadence—weekly, monthly, or quarterly—to keep your predictions sharp and adapt to what’s happening right now.
This review cycle is pretty straightforward, but you have to be disciplined about it:
- Forecast vs. Actuals Analysis: At the end of each period, put your forecast side-by-side with your actual revenue. This is your accuracy report card. The goal for many best-in-class companies is to keep the variance within +/- 5%.
- Identify Variances: Now, play detective. Why were the numbers different? Did that huge deal you were banking on slip into next quarter? Did a marketing campaign suddenly catch fire and bring in a flood of new business? Be specific: "We missed the forecast by $50k because the enterprise deal with Acme Corp was delayed by legal review."
- Refine Your Assumptions: Take what you learned and feed it back into your forecasting model. Adjust your assumptions based on what really happened. For example, if deals are consistently taking two weeks longer to close than you thought, update your average sales cycle length in the model.
Over time, this feedback loop makes your predictions smarter and more accurate. This rhythm doesn't just build accountability—it turns your forecast into a dynamic tool that helps you steer the ship with confidence.
Avoiding Common Forecasting Pitfalls
Even with the best models and processes in place, a few common mistakes can quietly torpedo the accuracy of your revenue forecast. Building a reliable projection is as much about dodging these traps as it is about picking the right methodology. Knowing what they are is the first step toward creating a forecast you can actually count on.
One of the biggest culprits is unchecked sales team optimism. Enthusiasm is fantastic, but projections based purely on a salesperson's gut feeling often create a massive gap between the forecast and reality. A deal isn't closed until the ink is dry, and assuming every promising conversation will convert is a recipe for a bad time.
The best way to counter this is to ground those rosy sales projections in cold, hard data. You have to balance your team's confidence by digging into your CRM and analyzing past conversion rates. For instance, if your data shows that historically only 40% of deals that reach the "proposal" stage actually close, you need to apply that metric to your current pipeline. This injects a necessary dose of realism and is a key part of our guide on how to improve sales team performance.
Overlooking Market Changes and Dirty Data
Another major pitfall is relying too heavily on past performance, especially when the market itself is in flux. Simply assuming last year’s growth will magically repeat itself—without factoring in new competitors, economic headwinds, or shifts in customer behavior—is like driving while looking only in the rearview mirror. Your forecast has to be a forward-looking instrument.
A forecast is only as reliable as the data it's built on. Incomplete or inaccurate data doesn't just lead to small errors—it creates a fundamentally flawed picture of your financial future.
Finally, you can't overstate the danger of "dirty" data. Think incomplete CRM records, duplicate entries, or messy data entry habits. This stuff poisons your forecast right from the source. Gartner research indicates that organizations believe poor data quality to be responsible for an average of $15 million per year in losses. If your data is a mess, any projection you build from it will be just as untrustworthy, making the whole exercise pointless. Regularly cleaning and validating your data isn't just a tedious chore; it's essential maintenance for a healthy, accurate forecast.
A Few Final Questions About Revenue Forecasting
We get these questions a lot, so let's clear them up.
How Often Should I Be Updating My Revenue Forecast?
There isn't a single magic number here—it really depends on the pulse of your business. If you're in a fast-paced industry like SaaS or a high-growth agency, you might find yourself checking in monthly or even weekly. Things just move too quickly to wait.
For more stable businesses, a quarterly review is often enough. The real rule of thumb? Revisit your forecast anytime something significant happens. That could be landing that whale of a client you've been chasing, losing a key account, or even just noticing a major shift in your market.
What's the Difference Between a Sales Forecast and a Revenue Forecast?
This is a common point of confusion. Think of it this way: a sales forecast is all about volume. It answers the question, "How many units or projects do we expect to sell?" It focuses purely on the output of the sales team.
A revenue forecast is broader and asks, "How much money will we actually bring in?" It starts with the sales forecast but then layers on all the other financial details. It accounts for your pricing strategy, potential discounts, expected returns, and any other income you have, like retainers, subscription fees, or professional services.
You could say sales forecasting is just one ingredient in the revenue forecasting recipe. One predicts what you'll sell, while the other predicts the total cash you'll actually earn from everything you do.
Ready to stop guessing and start targeting high-growth companies? FundedIQ delivers hand-curated lists of recently funded startups, complete with decision-maker contacts and critical buying signals. Find your next client on FundedIQ.