What Is Data Driven Decision Making? Boost Business Success

- Why Smart Decisions Are Driven By Data, Not Gut Feelings
- The Four Pillars of Data Driven Decision Making
- How a Data-First Culture Drives Real Business Growth
- Real-World Examples of Data-Driven Success
- Your Step-By-Step Guide to Implementing a Data-Driven Strategy
- Navigating Common Roadblocks on Your Data Journey
- Got Questions About Data-Driven Decision Making?
At its core, data-driven decision making (DDDM) is the practice of making organizational choices based on the analysis of hard evidence—facts, metrics, and data—instead of relying solely on intuition or anecdotal experience. A study by MIT found that companies that adopt DDDM achieve, on average, 5-6% higher productivity and profitability than their peers. Think of it as swapping out gut feelings for a grounded, objective reality to steer your business toward its goals more effectively.
Why Smart Decisions Are Driven By Data, Not Gut Feelings
For a long time, business leaders leaned heavily on their experience and instincts to get through tough spots. And while that experience is valuable, relying on it alone is like a pilot trying to fly a plane by just looking out the window. It's fine on a clear day, but what happens when you hit clouds or darkness?
Data provides the instruments you need to fly safely and accurately, no matter the conditions. It involves a systematic approach: collecting the right information, analyzing it, and pulling out insights that point you toward your next move.
This shift isn't just a trend; it's become a standard for how modern companies operate. We’re seeing a clear preference for strategies backed by real numbers. For instance, a report by MicroStrategy revealed that 94% of enterprises say data and analytics are important to their business growth and digital transformation. In companies that are truly leading the charge, 73.5% of executives say their processes are always data-driven.
Understanding the Core Concept
So, what is data-driven decision making, really? It's about starting with the right questions and then digging into your data to find the answers. Instead of assuming you know what your customers want, you analyze their behavior to find out what they actually do.
This method turns vague goals into specific, actionable steps. It helps you answer critical business questions like:
- Which marketing channels are giving us the best return on investment?
- What product features do our most valuable customers use the most?
- Where are the biggest slowdowns in our sales funnel?
A data-driven approach doesn't get rid of the need for human expertise. It actually enhances it. It provides a solid foundation of evidence, allowing experienced leaders to make even better judgments and come up with truly innovative strategies.
From Information to Implementation
The whole point isn't just to gather a mountain of information; it's to turn that information into real-world improvements.
Imagine a retail company analyzing its sales data. They might discover a particular item flies off the shelves on weekends. Armed with that single insight, they can adjust their inventory, run targeted weekend promotions, and schedule more staff to capitalize on the demand and boost revenue. A simple analysis of POS data could reveal that sales of a specific winter coat spike by 300% on the first cold weekend of the year. The practical insight is to pre-stock inventory and launch a targeted ad campaign based on the 10-day weather forecast.
This creates a powerful loop of continuous improvement, where every decision provides new data that informs the next one. For a deeper look at this process, you can check out this guide on Mastering Data Driven Decision Making. It’s this iterative cycle that builds momentum and drives real, sustainable growth, proving that the best choices are always informed by evidence, not just instinct.
The Four Pillars of Data Driven Decision Making
Making great decisions with data isn't a single event; it's a disciplined process built on four key pillars. Think of it like a chef preparing a Michelin-star meal. You can't just toss ingredients into a pan and hope for the best. Every step is deliberate, building on the last to create something amazing.
The same logic applies here. Each pillar is crucial for turning raw information into a real strategic advantage. If you cut corners on one, the entire process suffers.
Pillar 1: Data Collection
Everything starts with data collection. This is where you gather all the relevant information needed to solve a problem or answer a question. Just as a chef hand-selects the freshest ingredients, your job is to identify and collect the right data. According to Gartner, poor data quality costs organizations an average of $12.9 million per year. Starting with low-quality data is a surefire way to get flawed answers down the line.
This means pulling information from different places, including:
- Internal Sources: Your own CRM systems (customer history, lead scores), sales data, website analytics (user session duration, bounce rates), and operational reports.
- External Sources: Market research reports, competitor analysis, social media trends (sentiment analysis), and public datasets (e.g., government economic data).
The goal isn't just to collect more data, but to gather a complete dataset directly tied to your business goals. Piling up data without a clear purpose is like buying random groceries without a recipe—you have a full pantry but no idea what to cook.
Pillar 2: Data Processing
Once you have your raw ingredients, it's time for data processing. A chef would never use unwashed vegetables or ungraded meat. In the same way, raw data is almost always messy, inconsistent, and full of errors. This pillar is all about cleaning and organizing your data to make it trustworthy.
This critical prep work involves a few key tasks:
- Cleaning: Getting rid of duplicate entries, fixing errors (like "NY" vs. "New York"), and figuring out what to do with missing values.
- Structuring: Putting the data into a standard, usable format, like a database or spreadsheet.
- Integrating: Combining data from different sources to create one single, unified view.
For example, your customer data might live in separate sales, marketing, and support systems. Processing brings it all together to create one accurate profile for each customer, ensuring your analysis is based on the whole picture.
Pillar 3: Data Analysis
With clean, organized data ready to go, you can finally move on to data analysis—this is the "cooking" stage. Here, you start exploring the data to find patterns, spot trends, and pull out meaningful insights. This is the moment raw facts start turning into actual knowledge.
This infographic shows how a solid data-driven process can branch into major business improvements.
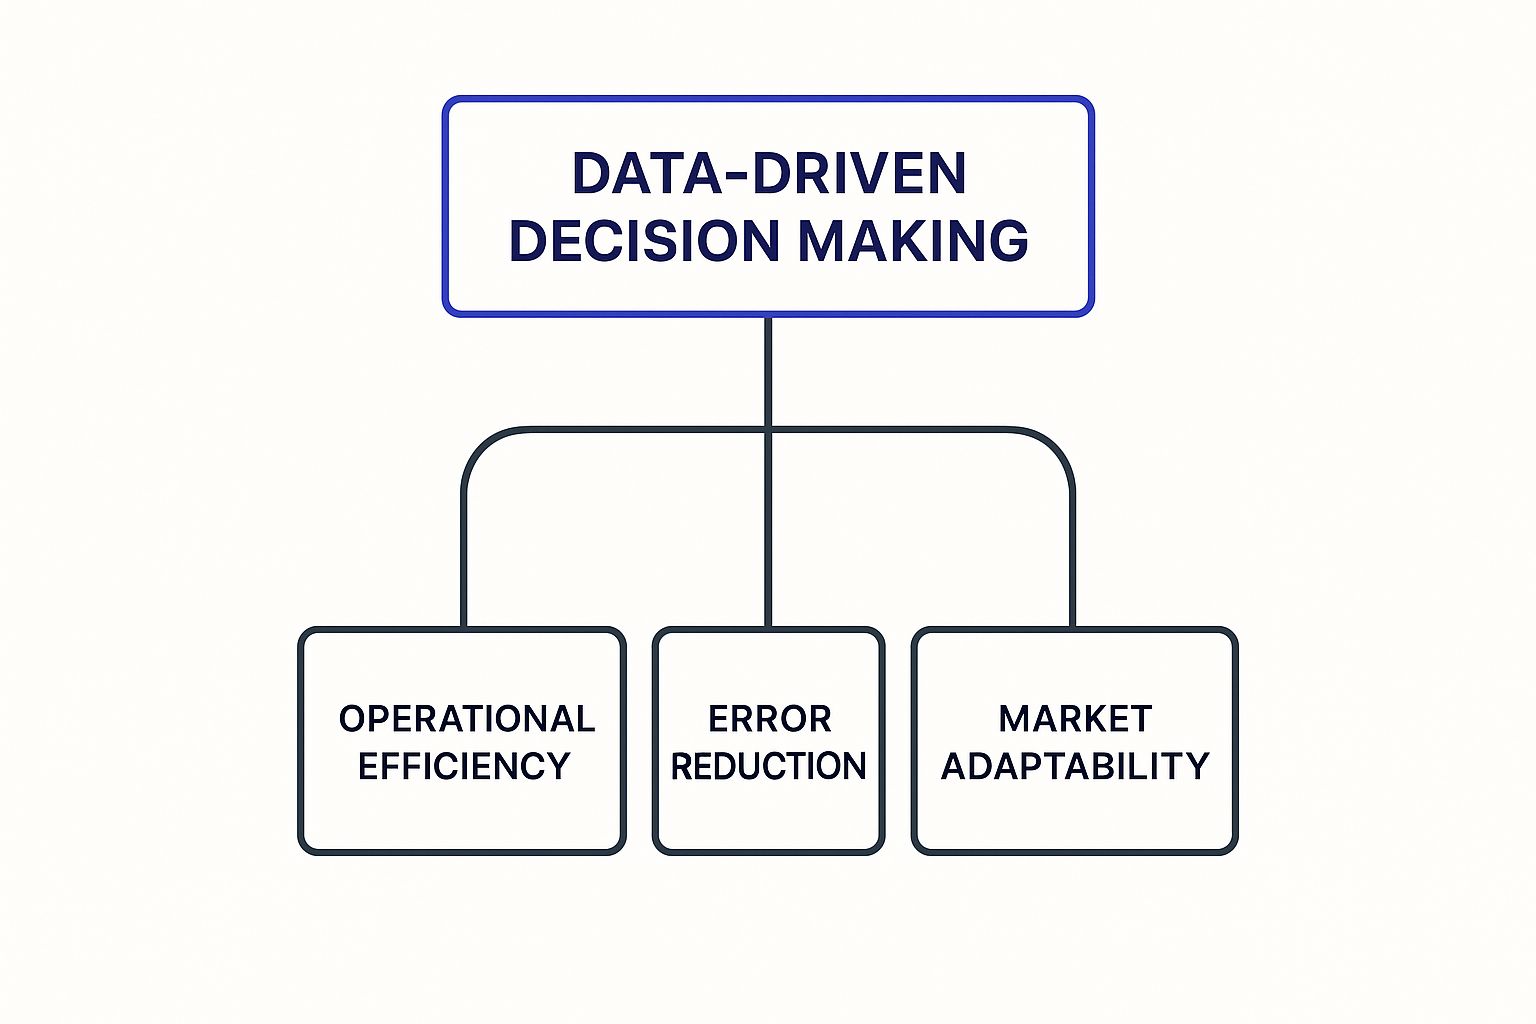
As the visual shows, a commitment to this process pays off in tangible ways, like boosting efficiency, cutting down on mistakes, and helping you adapt faster to market changes.
Pillar 4: Actionable Insights
The final and most important pillar is turning your findings into actionable insights. A perfectly cooked meal doesn't do anyone any good if it never leaves the kitchen. In the same way, analysis without action is just an interesting but pointless exercise. This last step is all about figuring out what the data is telling you to do.
An insight is only valuable if it leads to a better decision. The whole point is to drive real actions that move the business forward, not just to uncover interesting patterns.
For instance, if your analysis shows that customers who watch a product demo video are 50% more likely to make a purchase, the actionable insight is clear: invest more in video content and feature it prominently throughout the customer journey. This is where you close the loop, turning data into measurable results.
How a Data-First Culture Drives Real Business Growth

It’s one thing to talk about the theory behind data-driven decisions, but what really gets people’s attention is the impact on the bottom line. When an entire organization gets behind a data-first culture, it stops making vague "smarter choices" and starts delivering specific, measurable results. This shift is fundamental—it turns a business from being reactive to proactive, building a powerful engine for sustainable growth.
The numbers don't lie. Research from Forrester shows that data-driven organizations are 58% more likely to beat their revenue goals than their non-data-driven peers. Moreover, research by McKinsey shows companies that truly lean into their data are 23 times more likely to acquire customers, six times more likely to keep them, and a staggering 19 times more likely to be profitable than competitors who don't. That’s not a small difference; it’s a game-changer.
Boosting Profitability Through Optimization
One of the first places you’ll see the impact of a data-driven culture is in your profit margins. By diving into operational data, companies can find and fix inefficiencies with near-surgical precision. This isn’t just about slashing budgets; it’s about making every process leaner and more effective to get the most out of every dollar spent.
Think about a logistics company like UPS. They famously developed an algorithm (called ORION) that analyzes route data, traffic patterns, and delivery schedules to optimize their drivers' daily routes. This system helps them shave millions of miles off their routes each year, saving an estimated $300 to $400 million annually in fuel and labor costs.
Deepening Customer Understanding
In today’s crowded marketplace, truly knowing your customer is your best competitive advantage. Data lets you get past generic demographic buckets and build a rich, detailed picture of what individual customers actually do, what they prefer, and what frustrates them. This is the bedrock of any strong, lasting customer relationship.
For example, a retail brand can track a customer's purchase history and browsing activity to send marketing offers that feel personal. Instead of blasting everyone with the same 10% off coupon, they can offer a special discount on a product that a specific customer has looked at three times. According to a McKinsey report, this level of personalization can lift revenues by 5-15% and increase marketing spend efficiency by 10-30%.
Adopting a data-first mindset means every customer interaction becomes an opportunity to learn. It transforms marketing from a broadcast into a conversation, where you are constantly listening and adapting to meet customer needs.
This feedback loop allows you to constantly refine your products and improve your service, creating a brand people genuinely trust. If you're ready to put these ideas into motion, our guide on turning insights into actionable strategies is a great place to start.
Mitigating Risks Proactively
Finally, a data-driven approach helps a business see what's coming and sidestep problems before they get out of hand. By keeping an eye on key metrics and spotting unusual patterns, you can catch risks early and take action. It’s the difference between constantly putting out fires and preventing them from ever starting.
Consider a financial services firm using real-time transaction data. By flagging activity that doesn't fit a customer's usual spending pattern, they can spot potential fraud almost instantly. These predictive models can analyze thousands of data points—like transaction amount, location, and time—in milliseconds. This not only protects their customers' accounts but also saves the company from massive financial losses and damage to its reputation.
Real-World Examples of Data-Driven Success
https://www.youtube.com/embed/yZvFH7B6gKI
It's one thing to talk about data in theory, but seeing it in action is where the concept really clicks. The true power of data-driven decision-making shines when you look at how real companies use it to solve tough problems and pull ahead of the competition.
Let's break down how some of the biggest names in business have turned raw information into incredible results. Each of these stories follows a similar path: a company had a major challenge, they used data to figure out a plan, and the outcome was a game-changer.
Netflix: How Data Greenlights Blockbusters
Before Netflix, Hollywood ran on gut feelings. Studio executives with decades of experience would bet millions on which scripts would become hits. Netflix decided to flip the script by letting audience data call the shots.
The company tracks everything—what you watch, when you hit pause, which scenes you re-watch, and even the thumbnail images that make you click. This goldmine of information provides a deep understanding of what viewers actually want. When they were considering House of Cards, it wasn't a blind guess. They knew from their data that a huge chunk of their audience loved David Fincher’s films (like The Social Network) and also binge-watched political dramas starring Kevin Spacey.
Connecting those dots gave them the confidence to make a $100 million two-season commitment before a single episode was shot. The show was a smash hit, proving their data-first approach worked. Today, that same thinking fuels their recommendation algorithm, which is estimated to be worth $1 billion per year as it drives over 80% of the content people watch.
Amazon: Mastering the Supply Chain
Amazon’s complete dominance of e-commerce isn't an accident; it's built on a foundation of using data to perfect its supply chain. The challenge was massive: how do you manage millions of products and get them to customers' doors with incredible speed? The answer was predictive analytics, fed by a constant stream of customer purchasing and browsing data.
By looking at what people buy, search for, and add to their wish lists, Amazon can forecast demand for certain products in specific regions with stunning accuracy. This means they can move products into warehouses closer to you before you even decide to buy them, a practice known as "anticipatory shipping" (for which they hold a patent).
Amazon's logistics are so dialed in that the company can often predict what you need before you do. This proactive stocking is the engine that powers their famous one-day and same-day delivery, completely resetting customer expectations for everyone else.
This isn't just about making customers happy. It also slashes storage costs and cuts down on waste, making the entire operation more efficient and profitable.
Healthcare: Refining Treatments with Patient Data
Data-driven thinking isn't just for selling products; it’s making a life-saving impact in fields like healthcare. Imagine a large hospital system wanting to move beyond generic treatment guidelines to offer more personalized, effective care. The challenge was figuring out what truly works best for different kinds of patients.
To solve this, they started collecting and analyzing anonymized patient data—things like treatment histories, genetic markers, recovery speeds, and long-term outcomes. By sifting through this information, they could spot patterns. For instance, they might find that a specific medication leads to a 15% better recovery rate in patients over 60 with a particular condition.
These insights allow doctors to constantly refine their methods, ensuring that every new patient benefits from the collective experience of thousands who came before them. This approach not only improves health outcomes but also helps hospitals predict public health trends, such as flu outbreaks, allowing them to allocate resources more effectively. To see how AI can take this even further, you can explore various use cases of AI in data-driven decision-making.
Your Step-By-Step Guide to Implementing a Data-Driven Strategy
Shifting to a data-driven culture isn't something that happens overnight. It's a gradual process that requires a solid plan—one that weaves together the right strategy, technology, and a fundamental change in how your team thinks. Here’s a practical guide to get your organization on the right track.
Step 1: Define Clear Business Goals
Before you even think about opening a spreadsheet, you need to know what you're trying to accomplish. A data strategy without a clear business goal is like a ship without a rudder.
Start by asking sharp questions tied directly to your company's objectives. Don't settle for a vague goal like "increase sales." Instead, get specific: "reduce customer churn by 15% in the next quarter." A goal like that immediately gives your data efforts a clear mission. It tells you exactly where to look—at customer support tickets, product usage logs, and subscription renewal rates. A practical insight is to check for a drop-off in user engagement 30 days before their subscription is due to renew.
Step 2: Identify and Source the Right Data
Once you have your destination, you can figure out what information you need for the journey. This step is all about pinpointing the key data sources that will answer the questions your goals raise. Remember, quality beats quantity every time.
Take a look at what you already have:
- Customer Relationship Management (CRM) Systems: Goldmines for insights into sales cycles and customer interactions.
- Website Analytics: Perfect for understanding user behavior, conversion funnels, and traffic sources.
- Financial Records: The source of truth for tracking revenue, costs, and profitability.
- Operational Data: Essential for monitoring things like production efficiency or supply chain logistics.
This is also the point where you’ll likely spot gaps. You might realize you need to invest in new tools to gather better information or clean up what you’ve got. For companies wanting to build richer customer profiles, exploring some of the best data enrichment tools can be a game-changer.
Step 3: Select the Appropriate Tools
With your data sources mapped out, you need the right tech to collect, process, and make sense of it all. The tools you choose should fit your team's skills and the complexity of your goals. You don't need a supercomputer to get started.
Your toolkit could include a mix of the basics and more advanced options:
- Business Intelligence (BI) Dashboards: Tools like Tableau or Google Data Studio are fantastic for visualizing key metrics.
- Analytics Platforms: Something like Google Analytics offers deep insights into web traffic and user engagement.
- Advanced Analytics Software: For bigger challenges, you might look at platforms that use statistical modeling or machine learning.
The aim here is to give your team the power to explore data and find answers on their own, without needing a degree in data science. The right tools make data feel approachable, not intimidating.
Step 4: Cultivate a Data-Literate Culture
Here's the most important part: technology alone is not enough. The real secret to becoming a data-driven organization is a cultural shift. It’s about creating an environment where team members feel empowered to ask tough questions, challenge assumptions with facts, and use analytics in their day-to-day work.
A data-driven culture isn't about turning every employee into a data scientist. It's about teaching every employee to ask the right questions of the data and use the answers to make better decisions in their role.
How do you build this? Focus on training and communication. Run workshops on how to use your new tools. Share success stories from small data projects to show what’s possible. And most importantly, encourage managers to lead by example by backing up their own decisions with evidence.
Step 5: Start with Small Pilot Projects
Finally, don't try to boil the ocean. The best way to build momentum is to start with small, manageable pilot projects. These projects should be designed for a clear, measurable win in a short amount of time.
For example, your marketing team could run a pilot project to A/B test email subject lines with the goal of improving open rates by 10%. The results are easy to measure, and a successful test delivers a clear ROI that gets everyone excited about what’s next. This practical, low-risk approach demonstrates value quickly and builds the case for larger investments.
This iterative approach—test, learn, and scale—is the engine of a successful data strategy. As you keep going, technology's role will only get bigger. By 2025, it's predicted that 75% of enterprises will shift from piloting to operationalizing AI, which will dramatically change how businesses find insights in real time.
Navigating Common Roadblocks on Your Data Journey

Making the switch to a data-first culture is a fantastic goal, but it's never as simple as flipping a switch. The road is often bumpy, and most companies run into the same handful of problems.
One of the biggest tripwires is simply poor data quality. If the information you're basing your decisions on is messy, incomplete, or wrong, any conclusion you draw will be shaky. It’s the classic "garbage in, garbage out" scenario, and it's the fastest way to make everyone lose faith in the whole idea.
The fix? Strong data governance. This just means you need a clear set of rules for how data gets collected, stored, and managed. Think of it as quality control for your information. For example, a practical rule could be standardizing all state fields to a two-letter abbreviation to prevent inconsistencies.
Overcoming Skills Gaps and Resistance
Another common roadblock is the skills gap. You can have the best data in the world, but if your team doesn't know how to interpret it or use the analytics tools, it’s just going to sit there.
You have to invest in your people. This doesn't mean sending everyone to a data science boot camp. It's about providing focused training that helps them understand the data relevant to their specific jobs. User-friendly dashboards are also a game-changer, making key insights accessible to everyone.
Then there’s the human element: resistance to change. Shifting from "gut feel" to data-backed decisions can feel like a threat to those who rely on experience alone. This cultural pushback can quietly sink the entire initiative.
To get buy-in, start small. Find a project where you can score a quick, obvious win. Maybe it's tweaking an ad campaign that improves lead conversion by 5%. When you can show people a tangible result, you’ll start winning over the skeptics. Nothing argues better than success.
Avoiding Analysis Paralysis
Here’s an ironic twist: sometimes, the problem isn't too little data, but too much. When your team is drowning in reports and dashboards, they can easily get stuck in analysis paralysis. With so much information, it becomes impossible to make a decision.
The way out is to stay laser-focused on your core business goals. Every piece of analysis should be tied directly back to a key performance indicator (KPI). For example, if you're digging into marketing data, you need to know how to measure marketing ROI so you can ignore vanity metrics like "likes" and concentrate on what actually moves the needle, such as customer acquisition cost (CAC). This keeps your team focused on delivering results.
Got Questions About Data-Driven Decision Making?
Even when you grasp the big picture, the practical side of putting data to work can bring up a lot of questions. Let's tackle some of the most common ones that pop up when you're ready to move from theory to reality.
Do I Need to Be a Data Scientist?
Not at all. While a data scientist is invaluable for wrestling with massive, complex data sets, you don't need a Ph.D. in statistics to make smarter decisions.
The real goal is to build a culture of curiosity and start asking, "What does the data say?" It's less about complex modeling and more about learning to ask good questions and using the right tools to get clear answers. Modern business intelligence (BI) platforms are built for people who aren't data experts, with intuitive dashboards that help anyone find insights relevant to their job.
What Are Some Simple Tools for a Small Business?
You don't need a huge budget to get started. Many small businesses can make huge strides with tools that are either free or already part of their toolkit.
- Google Analytics: This is non-negotiable if you have a website. It tells you who your visitors are, how they find you, and what they do, giving you a goldmine of information for your marketing.
- CRM Dashboards: Your CRM (think HubSpot or Salesforce) is more than just a contact list. Its built-in reports can show you what's working in your sales process and what's not.
- Spreadsheet Software: Never underestimate the power of Microsoft Excel or Google Sheets. They're perfect for tracking your most important numbers (KPIs) and creating simple charts that make trends easy to spot.
How Do You Avoid Getting Overwhelmed by Data?
It’s incredibly easy to get stuck in "analysis paralysis," where you have so much information that you can't make a decision. The secret is to stay laser-focused on what actually matters to your business.
The best way to cut through the noise is to tie every analysis directly back to a specific business goal. Don't just collect data; collect data with a purpose.
Before you even look at a spreadsheet, figure out the one question you need to answer. What are you trying to achieve? Concentrate on just a few key metrics that tell you if you're getting closer to that goal. For example, if your goal is to improve customer retention, your key metrics might be Churn Rate, Customer Lifetime Value (CLV), and Net Promoter Score (NPS). This approach keeps you from drowning in numbers and ensures your work leads to real action.
Ready to connect with the right prospects at the right time? FundedIQ delivers curated lists of recently funded startups, complete with verified decision-maker contacts and critical business intelligence. Stop guessing and start engaging high-intent leads with precision. Learn more and get your first lead list at https://funded.iq.